Improvements for the long-term
(includes GRI indicators EC2, EN5–EN7, EN18)
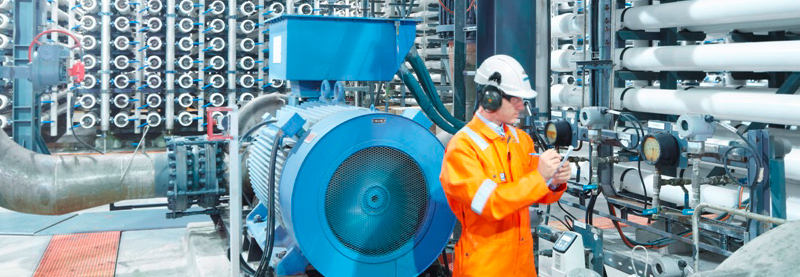
ABB’s Growth Strategy 2011–2015 identifies mitigation of climate change, renewable energy and energy efficiency as key drivers and growth opportunities for our business. Already, about 55 percent of our revenues are related to products and services in our energy efficiency portfolio that help customers save energy and reduce greenhouse gas emissions.
ABB can help industrial and utility customers improve energy efficiency by providing specialists to audit energy use and identify areas for improvement, and with equipment, systems and solutions to use energy more efficiently.
We have a wide range of products and services based on pioneering innovative technologies to reduce energy consumption and improve productivity. Our technologies are used along the entire energy value chain from the extraction of resources, the liquefication of natural gas or refinement of petroleum products, to their transformation into electricity and their efficient use in industry, transportation and buildings.
The link between energy efficiency, renewable energy and mitigating climate change is clear. The International Energy Agency (IEA), in its 2012 World Energy Outlook, says that economically viable energy efficiency measures could halve energy demand growth by 2035. Energy efficiency could delay the “lock-in” of CO2 emissions foreseen under the 2°C scenario from 2017 to 2022. Renewable energy is likely to become the world’s second largest source of power generation by 2015, second only to coal. However, without policy support, up to two thirds of the economically viable potential to improve energy efficiency will remain unrealized through 2035.
Despite the strong financial and environmental case for energy efficiency, many barriers remain blocking implementation of such measures. To overcome some of these barriers, ABB has designed a new approach to improving energy efficiency in industry. Using this approach, ABB has identified energy savings of five to 20 percent across a wide range of industries and utilities.
ABB in the United Kingdom has demonstrated its commitment to reducing greenhouse gas emissions by gaining the Certified Emissions Measurement and Reduction Scheme (CEMARS) certification. CEMARS is a carbon verification scheme that recognizes organizations for credible carbon measurement, management and reduction. The certification requires companies to audit their carbon footprint and demonstrate year on year reduction of emissions, while taking steps to mitigate emissions in the future.
ABB partners with the customer, assuming the performance risk for the solutions implemented and bundling multiple small projects into one major project to simplify execution. Providing the expertise and tools to execute efficiently, financing where needed, and measurement technologies to demonstrate performance improvement, ABB works to overcome customers’ risk aversion and to provide confidence in the delivery of real energy savings.
This approach is bringing real rewards for customers and the environment. For example, ABB worked with ArcelorMittal to identify annual energy savings of $13.5 million at a steel mill in France. The measures identified cover 53 individual energy savings opportunities, including both electrical and gas savings, along with some zero capital investment opportunities.
ABB in the United Kingdom has taken a similar approach to persuade customers to adopt energy-saving measures for motor-driven applications. Their Energy Efficiency Plan consists of a targeted energy appraisal that identifies energy and CO2 savings potential for no more than five selected applications, simplifying the process for the customer. The approach was recently recognized by the Engineering Employers’ Federation of the United Kingdom with the Future Manufacturing Green Growth Award.
In addition to our robust energy efficiency portfolio, ABB continues to make research and development investments as well as exploring early stage technologies and business processes through venture capital activity. Past activities have ranged from e-mobility to solutions for energy efficiency in data centers and smart grid communications.
After pioneering high-voltage direct current (DC) technology, ABB is now applying DC to medium- and low-voltage applications in electric vehicle charging, power distribution systems in ships, in buildings and in data centers. These investments are bringing rewards for the environment and for our business.
For example, ABB has supplied 165 web-connected DC chargers to Estonia to form the backbone of the world’s first nationwide fast-charging network for electric vehicles. Each charger can recharge an electric vehicle in just 15 to 30 minutes, a fraction of the eight hours standard chargers typically require.
ABB partnered with HP and Green, one of the top information and communications technology service providers in Switzerland to open the world’s most powerful data center using DC technology. ABB installed the one megawatt DC power distribution solution for the 1,100 m2 expansion of Green’s Zurich-West data center. The facility recently earned the Watt D’Or award, a prestigious energy efficiency award from the Swiss government, for the scale of energy savings achieved through the pioneering use of DC technology.
Solar technology in action
To demonstrate ABB’s solar capabilities, as well as reduce our own environmental impacts, more and more ABB facilities are installing on-site photovoltaic (PV) power plants. Currently, PV plants are installed or are being constructed at 18 ABB sites in 14 countries across Europe, Asia and Latin America. Globally, the installations contribute less than one percent of our annual electrical energy needs, but can contribute up to 50 percent of the installation’s electricity needs, such as in Hungary and Mexico.
Focus on “green” real estate
ABB also carefully considers potential environmental impacts when investing in our global real estate portfolio. The ABB Green Building Policy guides site selection, building design and choice of materials in order to maximize water and energy efficiency, minimize resource use and provide a comfortable and safe indoor environment for employees and visitors. The policy guides new development, refurbishment and selection and management of rented space.
Several recent and ongoing projects demonstrate the benefits of this approach:
- At Lodz in Poland, design of a new transformer factory is improving energy efficiency by incorporating upgraded insulation, skylights, renewable energy generation, a building management system to optimize ventilation, heating and cooling, energy efficient lighting design, as well as ABB electrical equipment with lower losses. Projections show that, compared with a standard building complying only with local requirements, the new building will save approximately 1,000 tons of CO2 emissions per year.
- A planned new HVDC center in Ludvika, Sweden will be certified to Leadership in Energy and Environmental Design (LEED) Gold status. Similar to Lodz, design has focused on good insulation, use of ABB systems for energy efficient building management, renewable energy, and water management.
- ABB’s new headquarters in Budapest, Hungary is one of the most environmentally efficient commercial development projects on the Hungarian office market and the first one to be pre-certified to LEED Platinum level. Intelligent building control systems, including ABB’s KNX-iBus technology, solar panels on the roof, gray water recycling and innovative heating and cooling solutions all help to minimize impacts.
Overall performance
As part of our goal to steadily increase the efficiency of our own operations, we have set ourselves the target of reducing energy use by 2.5 percent per year. This includes both direct and indirect energy use, for manufacturing processes and to operate buildings. For 2012, we have included Baldor operations in this target, using the baseline established in 2011.
We achieved our energy efficiency objective for 2012, reducing energy consumption per employee by more than three percent from 2011. Gas consumption was significantly reduced and electricity consumption decreased slightly in 2012, despite organic growth in production and employee numbers. District heat consumption, although a small contributor to our overall energy consumption, increased by 12 percent.
ABB facilities implemented a range of activities to achieve these results. Among the most common measures: switching to energy efficient lighting solutions, investigating and enhancing the insulation of buildings, implementing or updating heat recuperation from machines and processes, and optimizing heating, ventilation and cooling systems, often using ABB’s own technology. We expect to see further improvements in energy efficiency as energy savings programs gain traction.
Emissions of SF6 increased by more than 25 percent year on year. The majority of this increase was due to a 60 percent increase in volume from a particular type of production process. During 2012, that business undertook considerable work to adapt the design of the product and the production process, with the goal to eliminate up to three quarters of the SF6 consumed. We await approval of the new design by the relevant certification body. We continue to pursue emission reduction programs at different sites, with actions ranging from improved handling and inventory procedures to leak detection and improvements in storage methods. However, challenges remain to ensure appropriate handling procedures at both ABB and customer sites.
During 2012, we continued to work with our logistics suppliers to improve the quality and availability of emissions data from cross-border transportation and air and sea transportation of goods. A Transportation Council of regional and Group logistics managers helps to guide and coordinate Group transport and logistics strategy and programs.
Logistics optimization programs have also been initiated at Business Unit (BU) level. One good example is the cooperation between our BU Transformer factories in Lodz, Poland and Ludvika in Sweden. The challenge was to find a more efficient way to load trailers to reduce the number of trips from Lodz to Ludvika and to identify an efficient use for the return trips to ensure that the trailer did not return empty. Now, the loading has been optimized, the number of departures reduced from five to two per week and, with cooperation of a third factory at Figeholm in Sweden, the trailers return with production materials for Lodz. Costs have been reduced by €400,000 annually and associated CO2 emissions reduced by 70 percent.
In addition to existing programs to optimize modes and routes of transport, we started a project in 2012 to investigate packaging design. Improved packaging has the potential to reduce environmental impacts both through more efficient resource use for the packaging itself and through reduced transport emissions from lighter packaging and more efficient loading. The program is still in its pilot stages, with several ABB facilities currently screening the tools and methodology.
Greenhouse gas emissions from business air travel decreased by seven percent during 2012. Whilst there is slow progress in implementing action plans to reduce the environmental impacts of air travel, we are observing incremental changes. For example, many sites have improved or installed videoconferencing facilities to enable fuller participation in virtual meetings.
Energy and climate performance: Other GRI indicators
EN3 Direct energy use by ABB (Gigawatt-hours – GWh)
| Download XLS (17 kB) |
|
|
2012 |
a |
2011 +Baldor |
a |
2011 |
b |
2010 | ||||
|---|---|---|---|---|---|---|---|---|---|---|---|
| |||||||||||
|
Oil (11.63 MWh/ton) |
93 |
|
94 |
|
92 |
|
114 | ||||
|
Coal (7.56 MWh/ton) |
0 |
|
0 |
|
0 |
|
0 | ||||
|
Gas |
556 |
|
589 |
|
417 |
|
427 | ||||
|
Total direct energy |
649 |
|
683 |
|
509 |
|
542 | ||||
EN4 Indirect energy use: Consumption and losses at utilities (Gigawatt-hours – GWh)
| Download XLS (18 kB) |
|
|
2012 |
a |
2011 +Baldor |
a |
2011 |
b |
2010 | ||||||||
|---|---|---|---|---|---|---|---|---|---|---|---|---|---|---|---|
| |||||||||||||||
|
District heat consumption |
219 |
c |
195 |
|
195 |
|
223 | ||||||||
|
District heat: Losses at utilities |
33 |
|
29 |
|
29 |
|
33 | ||||||||
|
Electricity consumptiond |
1,599 |
|
1,621 |
|
1,447 |
|
1,335 | ||||||||
|
Electricity: Losses at utilities |
2,208 |
|
2,239 |
|
1,999 |
|
1,844 | ||||||||
|
Total indirect energy |
4,058 |
|
4,084 |
|
3,670 |
|
3,436 | ||||||||
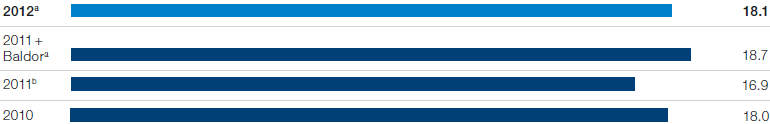
Megawatt-hours (MWh) per employee
| |||||||||||
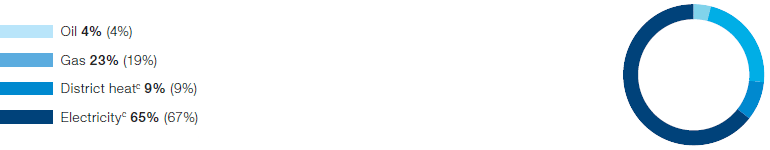
Direct and indirectc energy use by type for 2012a (2011b)
|
a |
Baldor facilities included; Thomas & Betts facilities not included |
|
b |
Baldor facilities not included |
|
c |
Not including losses at utilities |
EN16, EN17 Greenhouse gas emissions (kilotons CO2 equivalents)
EN29 Significant environmental impacts of transportation (kilotons CO2 equivalents)
| Download XLS (18 kB) |
|
|
2012 |
a |
2011 +Baldor |
a |
2011 |
b |
2010 | ||||||
|---|---|---|---|---|---|---|---|---|---|---|---|---|---|
| |||||||||||||
|
Scope 1 |
|
|
|
|
|
|
| ||||||
|
CO2 from use of energy |
137 |
|
144 |
|
109 |
|
117 | ||||||
|
SF6 |
332 |
|
263 |
|
263 |
|
247 | ||||||
|
CO2 from transport by own fleetc |
350 |
|
350 |
|
350 |
|
350 | ||||||
|
Scope 2 |
|
|
|
|
|
|
| ||||||
|
District heat consumption |
48 |
|
43 |
|
43 |
|
49 | ||||||
|
District heat: Losses at utilities |
7 |
|
7 |
|
7 |
|
8 | ||||||
|
Electricity consumption |
337 |
|
348 |
|
309 |
|
293 | ||||||
|
Electricity: Losses at utilities |
465 |
|
480 |
|
427 |
|
405 | ||||||
|
Scope 3 |
|
|
|
|
|
|
| ||||||
|
Air travel |
171 |
|
n/a |
|
185 |
|
160 | ||||||